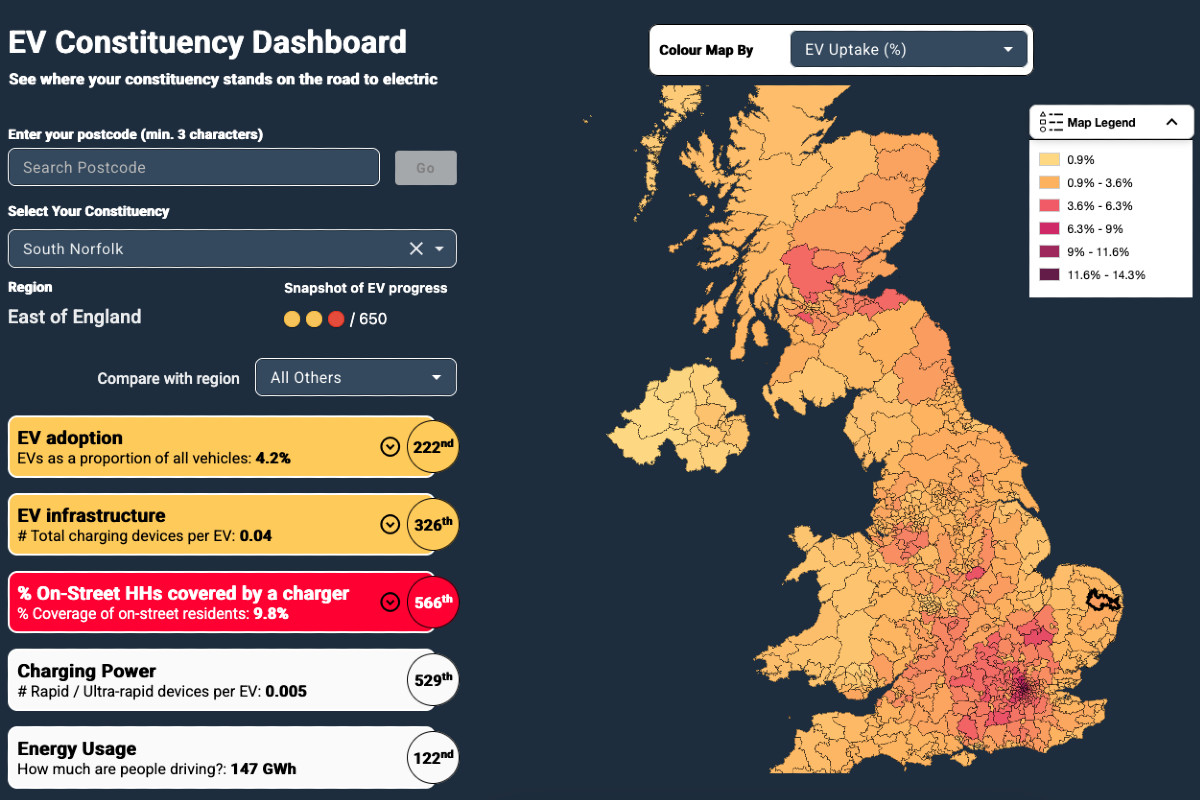
EVA England has launched an updated EV Constituency Dashboard for England, revealing sharp differences between local areas in both electric vehicle uptake and access to public charging, particularly for households without off-street parking.
Developed by Field Dynamics with input from Zapmap, the interactive map provides a constituency-by-constituency breakdown of EV adoption and public chargepoint coverage across England.
The new release comes two years after EVA England first published the tool. In that time, the EV market has shifted dramatically: electric cars now account for nearly a quarter of all new car sales, public chargepoints have grown to more than 86,000, and consumer confidence continues to rise. EVA England’s own survey suggests 95% of EV drivers would recommend an electric car to friends and family, while around two-thirds of petrol and diesel drivers say they are considering an EV for their next vehicle.
However, with an estimated 40% of UK households lacking access to off-street parking – and therefore to convenient home charging – the organisation argues that equitable access to affordable, reliable public charging is now the single biggest factor influencing EV uptake.
Postcode lottery in near-home charging
For the first time, the updated map shows how well each constituency is serving drivers who cannot charge at home, by analysing how many households without off-street parking are within a five-minute walk of a public chargepoint.
The top five constituencies on this metric are:
- Queen’s Park and Maida Vale
- Peckham
- Kensington and Bayswater
- Islington South and Finsbury
- Hackney South and Shoreditch
In all of these areas, more than 99% of households are within reach of a public chargepoint. In Queen’s Park and Maida Vale, and Kensington and Bayswater, more than 10% of cars in the constituency are already electric, suggesting that dense, near-home public charging can support higher levels of EV adoption.
Outside London, cities such as Coventry and Brighton are also singled out for making significant progress. In Coventry South, just under 90% of households are now within a five-minute walk of a charger, potentially making it easier for drivers without driveways or garages to consider switching to electric.
By contrast, the dashboard flags a number of constituencies where EV uptake is still low. EVA England defines uptake as the estimated number of EVs as a proportion of all vehicles in a constituency, and the map identifies five areas where 2% or fewer of vehicles are electric:
- Smethwick
- West Bromwich
- Plymouth Sutton and Devonport, and Plymouth Moor View
- Tipton and Wednesbury
- Kingston upon Hull
These figures, EVA England suggests, underline the need for more targeted support and clearer messaging in places where drivers remain unconvinced that EVs can work for them day to day.
Vicky Edmonds, Chief Executive of EVA England, noted, “We built this Map to shine a light on the real-world experience of drivers using and charging their cars within the communities they live in. EVA England is focused on making sure that policy and industry decisions are grounded in the lived experience of EV drivers. Only then can we make the transition to electric work for everyone.
“The updated map shows clear areas of progress, in both attracting drivers into EVs and also in the charging infrastructure available to them, but also clear gaps. Continued collaboration across industry and government will be essential, and so will the voices of EV drivers who understand the day-to-day reality of driving and charging these vehicles better than anyone.”
Tool for MPs, local authorities and residents
Beyond ranking constituencies, the dashboard is designed to let local authorities, chargepoint operators, policymakers and residents compare their area with neighbours and regional averages. In particular, it highlights where public charging is keeping pace with consumer demand – and where it is not.
According to EVA England, the map enables users to see:
- The proportion of households using EVs in every constituency
- The number and type of public chargepoints available locally, including slow, fast, rapid and ultra-rapid infrastructure
- How each constituency compares with nearby areas and the wider region
- Where growing demand for EVs is being matched by public charging – and where gaps remain
EVA England hopes the tool will support more informed decisions by local authorities, help the public understand charging provision in their own area, motivate action to encourage more EV uptake in constituencies that are falling behind, and ensure that national policy keeps pace with on-the-ground need.